Every Shopify order,
mapped on a living globe.
Naksalite turns your order and customer history into an interactive map — watch clusters light up in real time, drill from country to neighborhood, and find your next market before your competitors do.
Installs in under a minute · No credit card · 14-day Pro trial
One map. Three perspectives.
Flip between views to spot what a table of numbers hides.
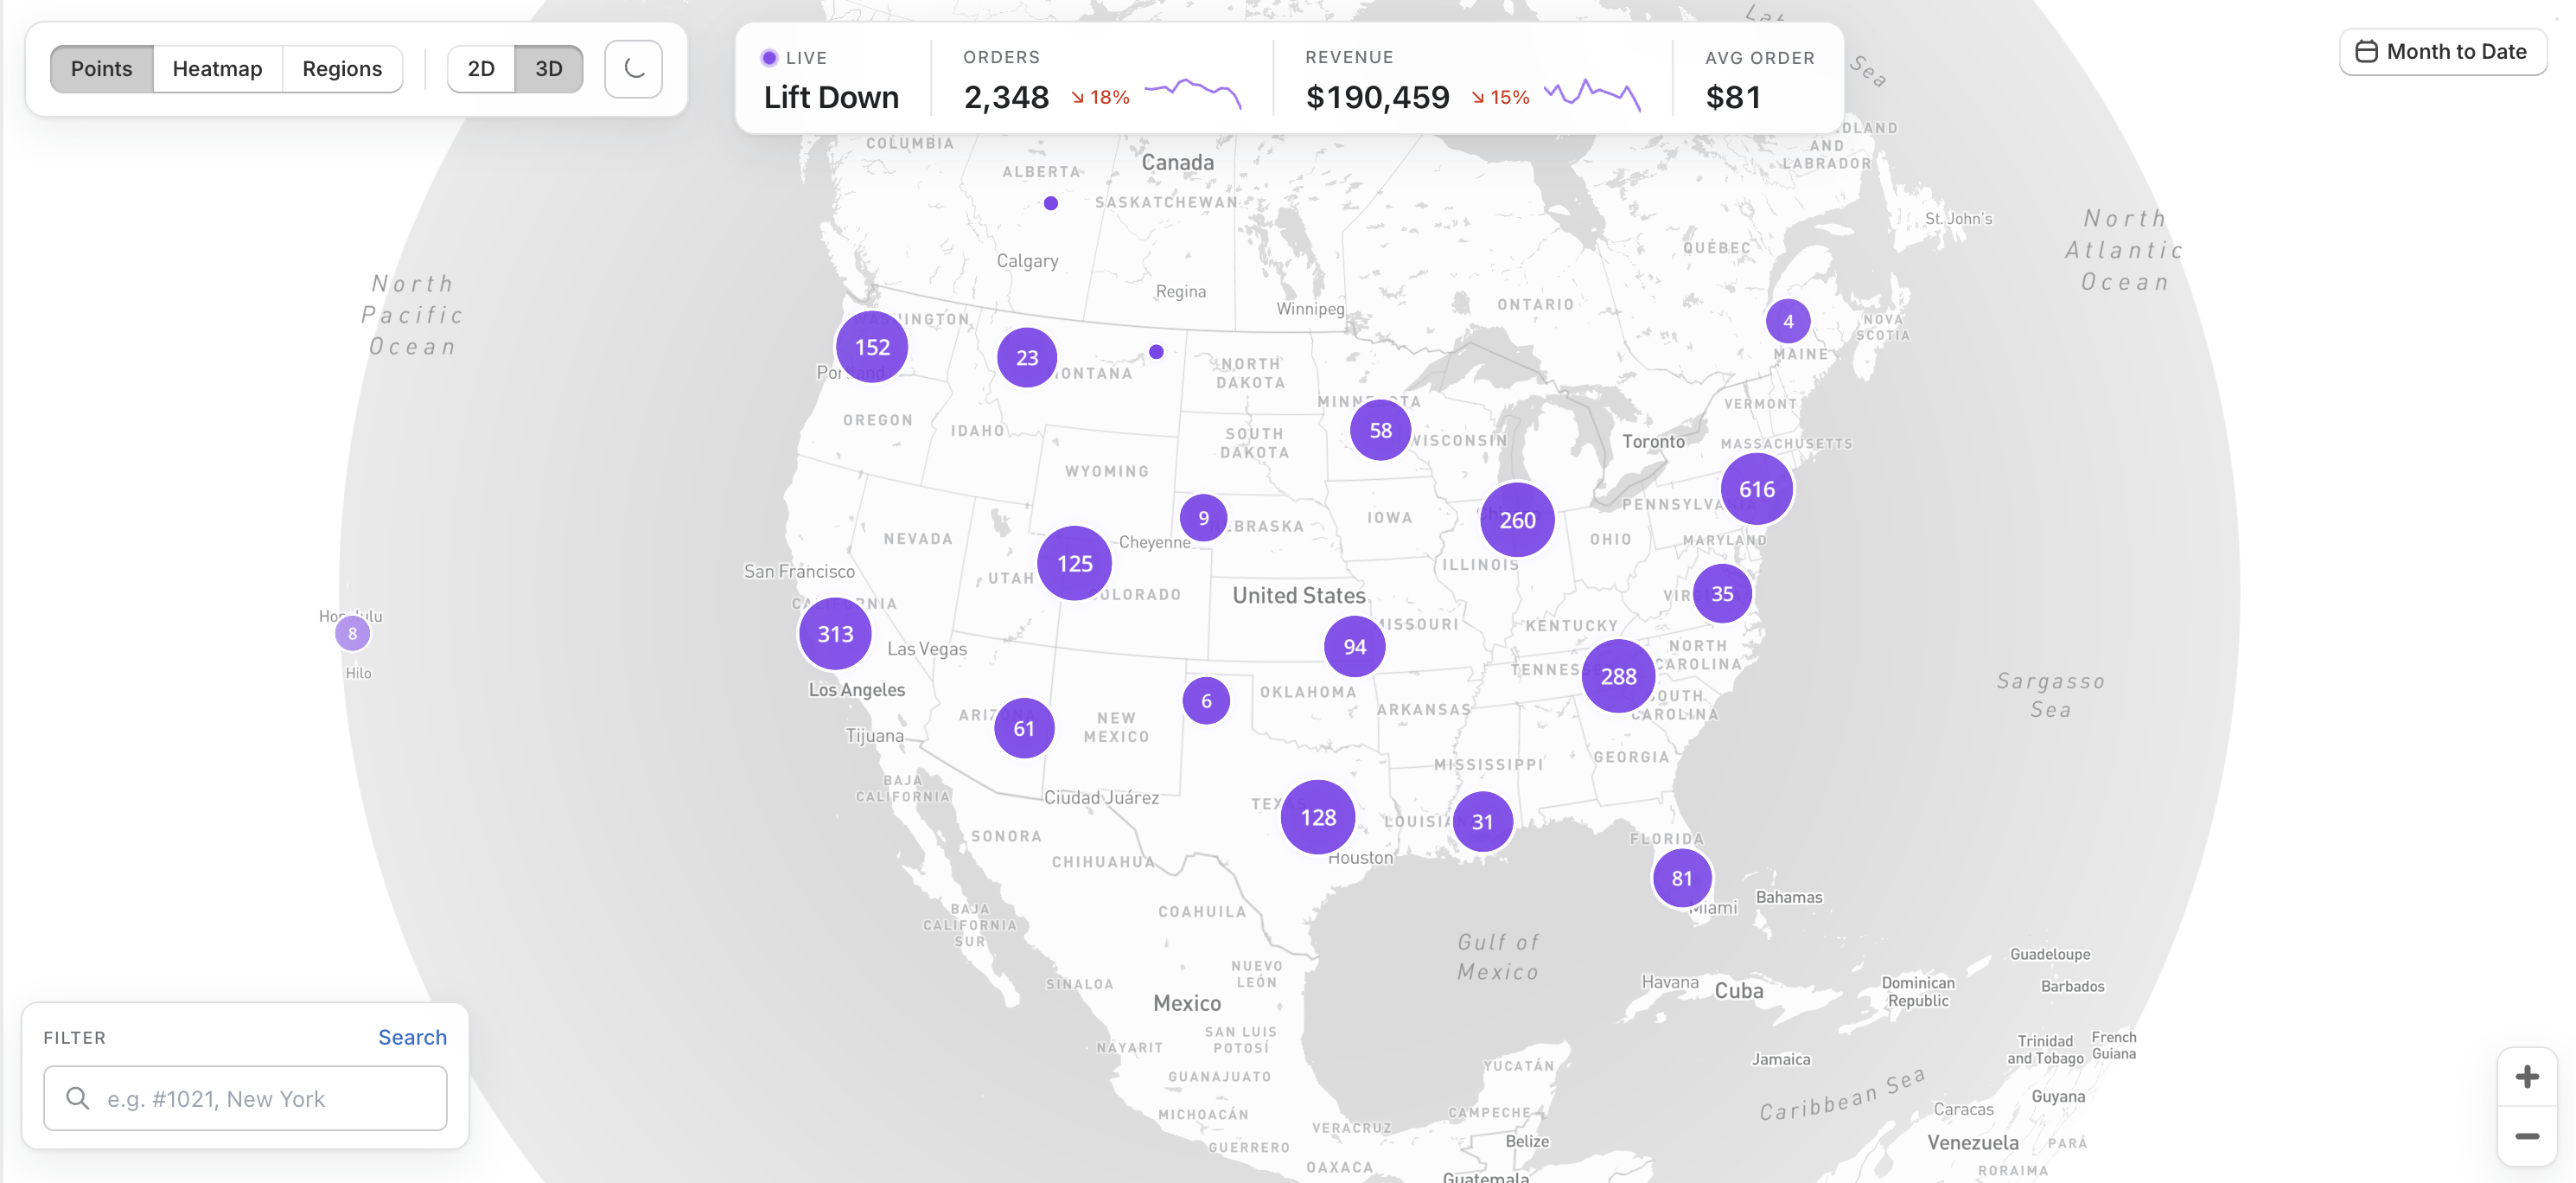
Points
Every order as a dot. Clusters bloom where your brand is alive. Hover a point to drill into the underlying orders.
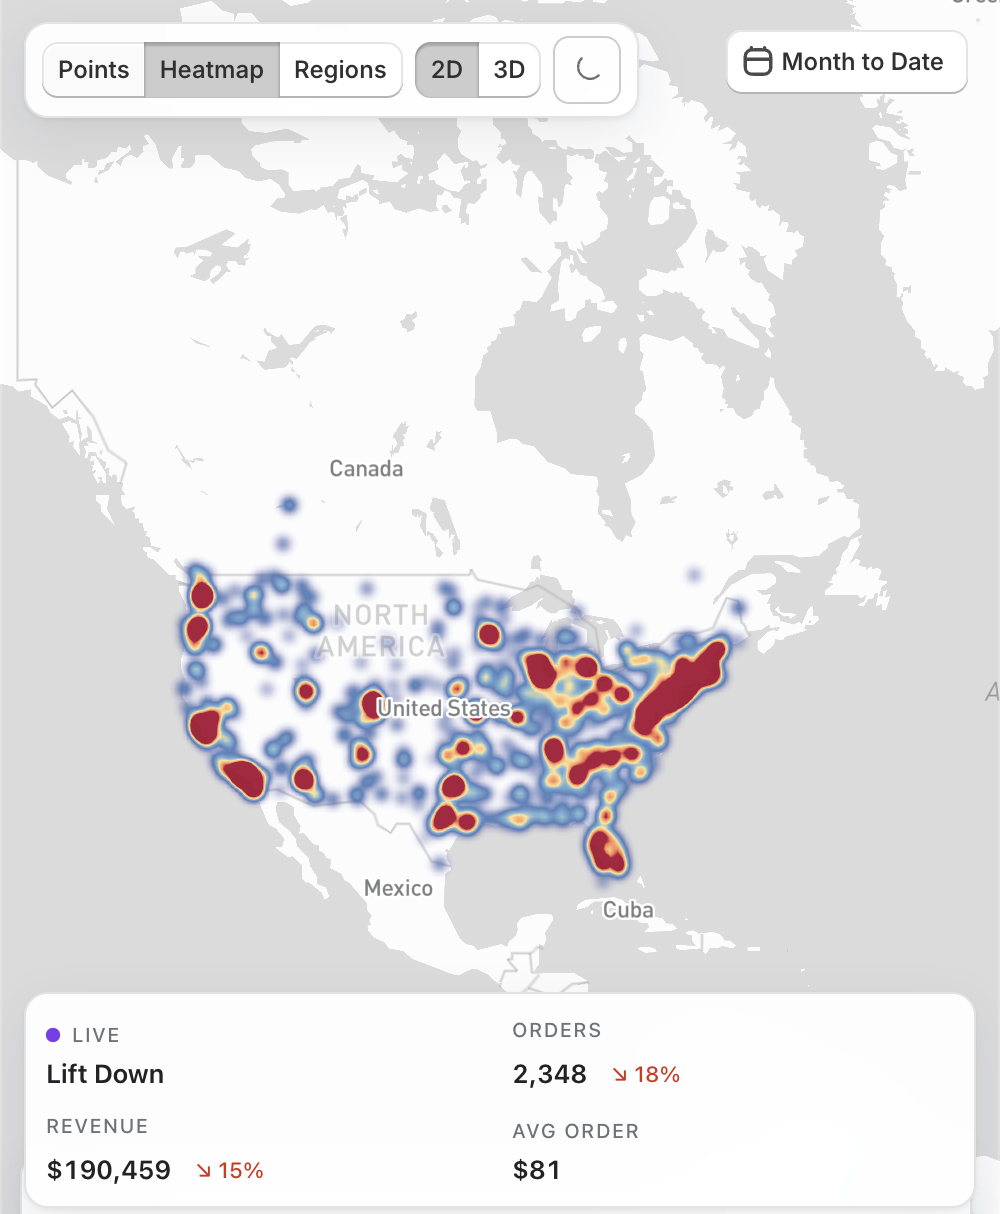
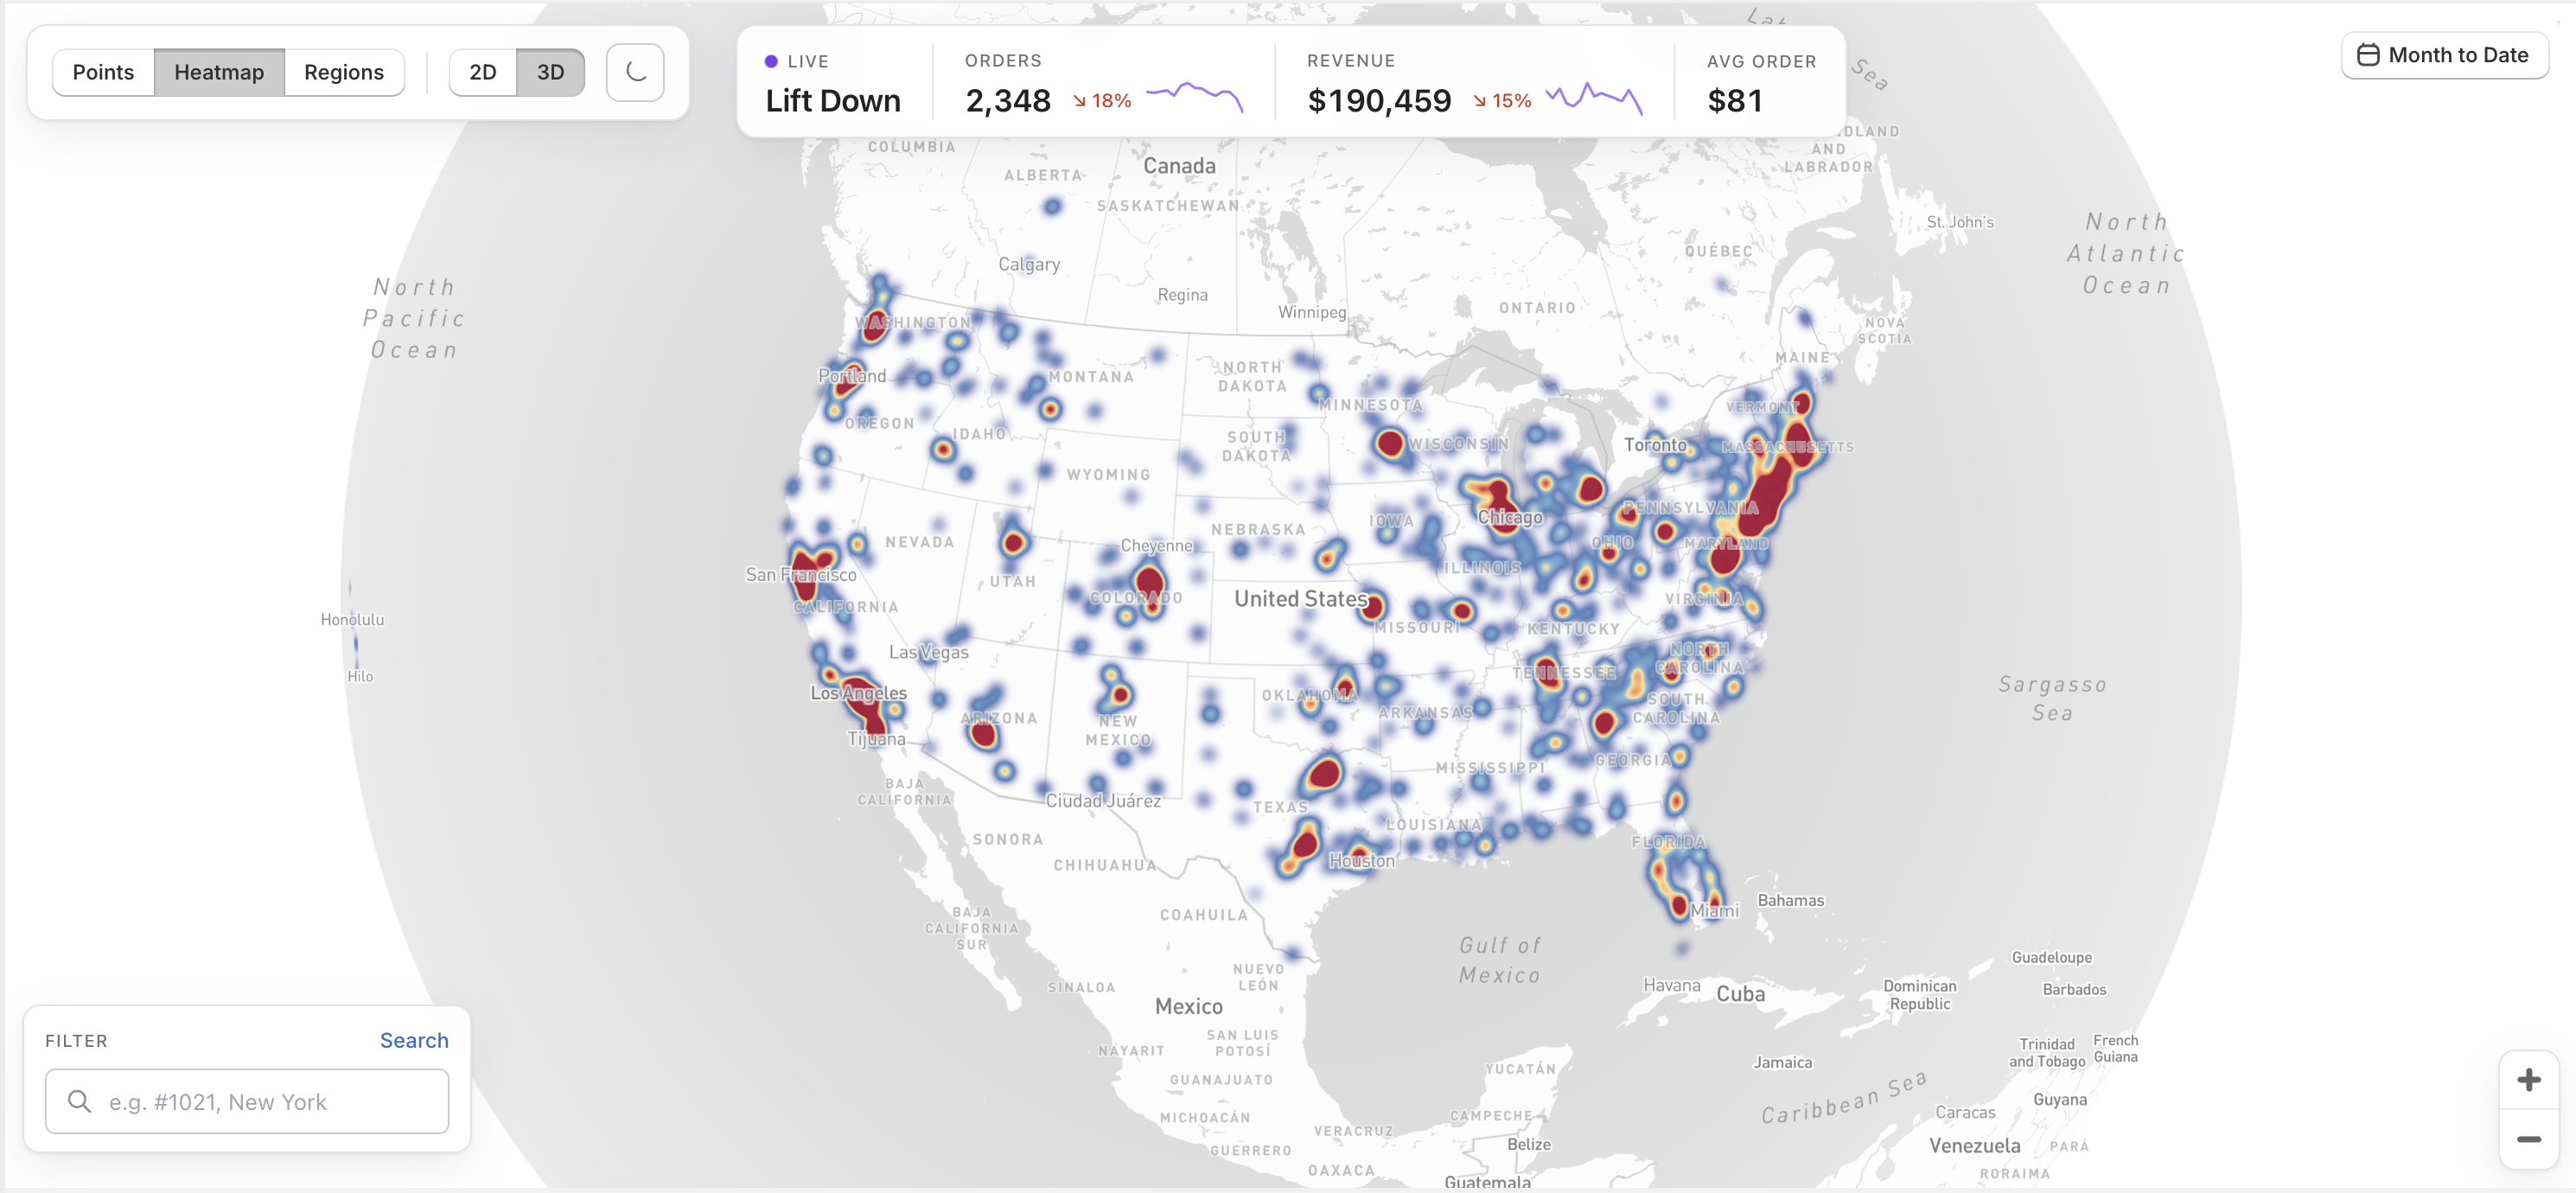
Heatmap
See demand density at a glance. Warm tones reveal your hotspots; quiet zones tell you where to invest next.
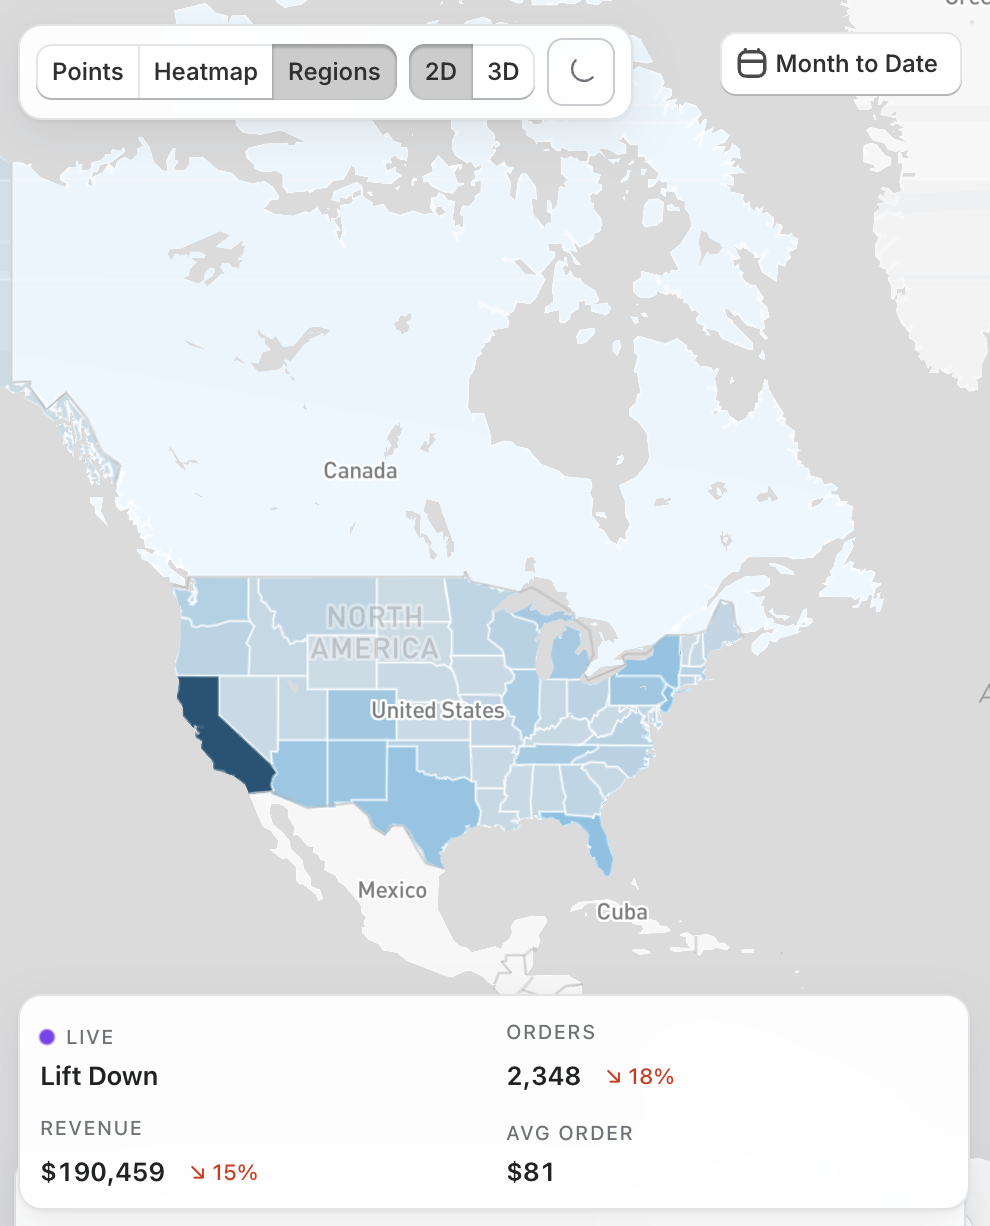
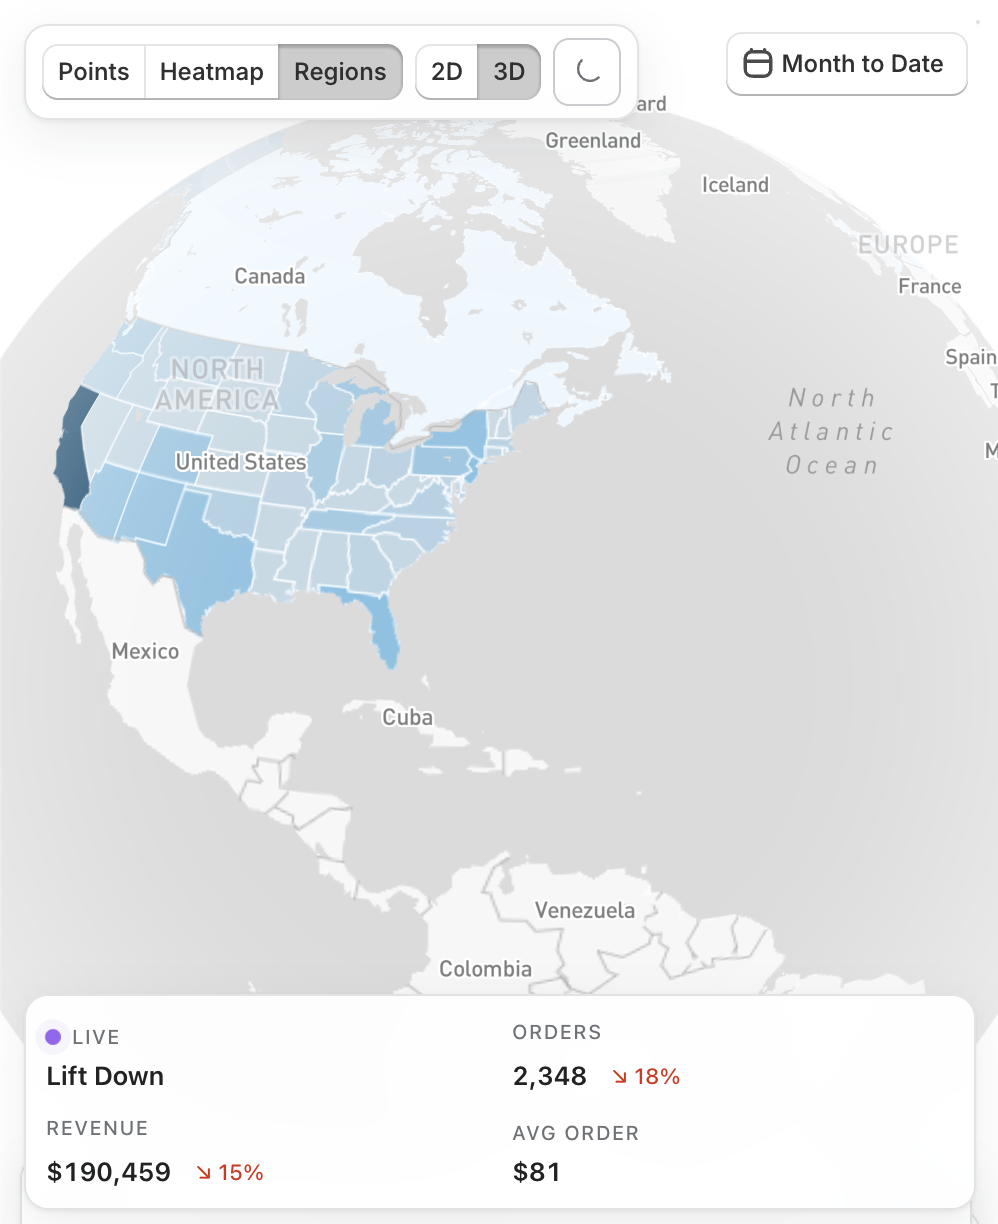
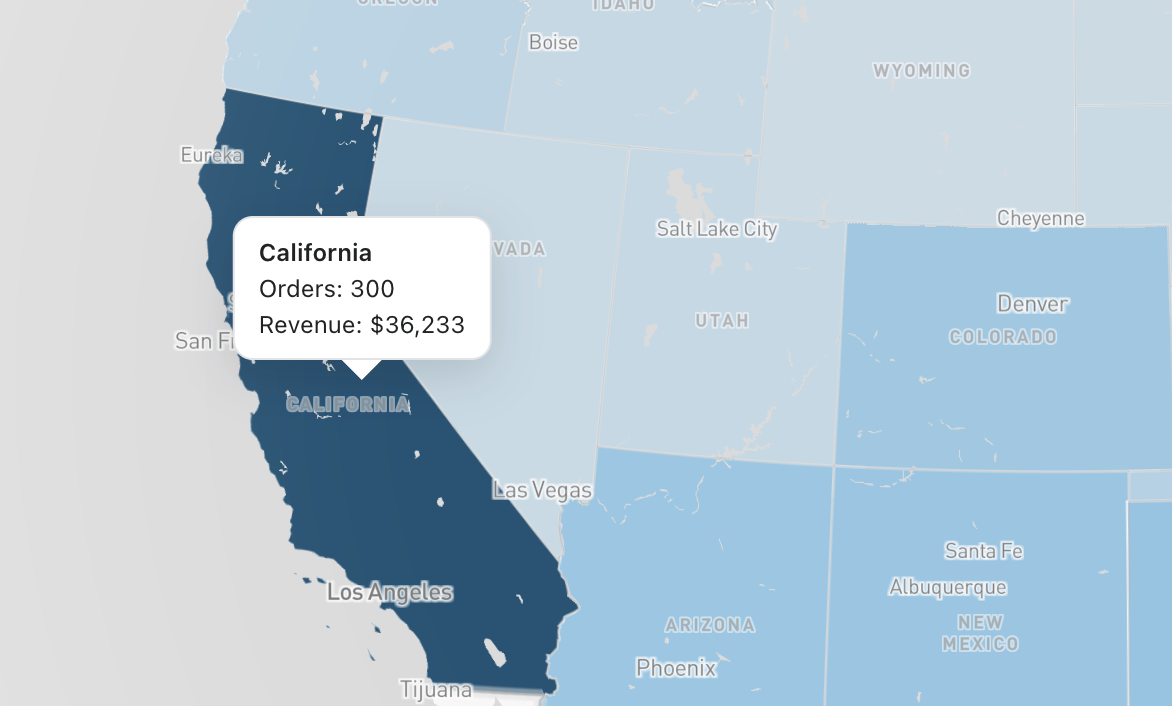
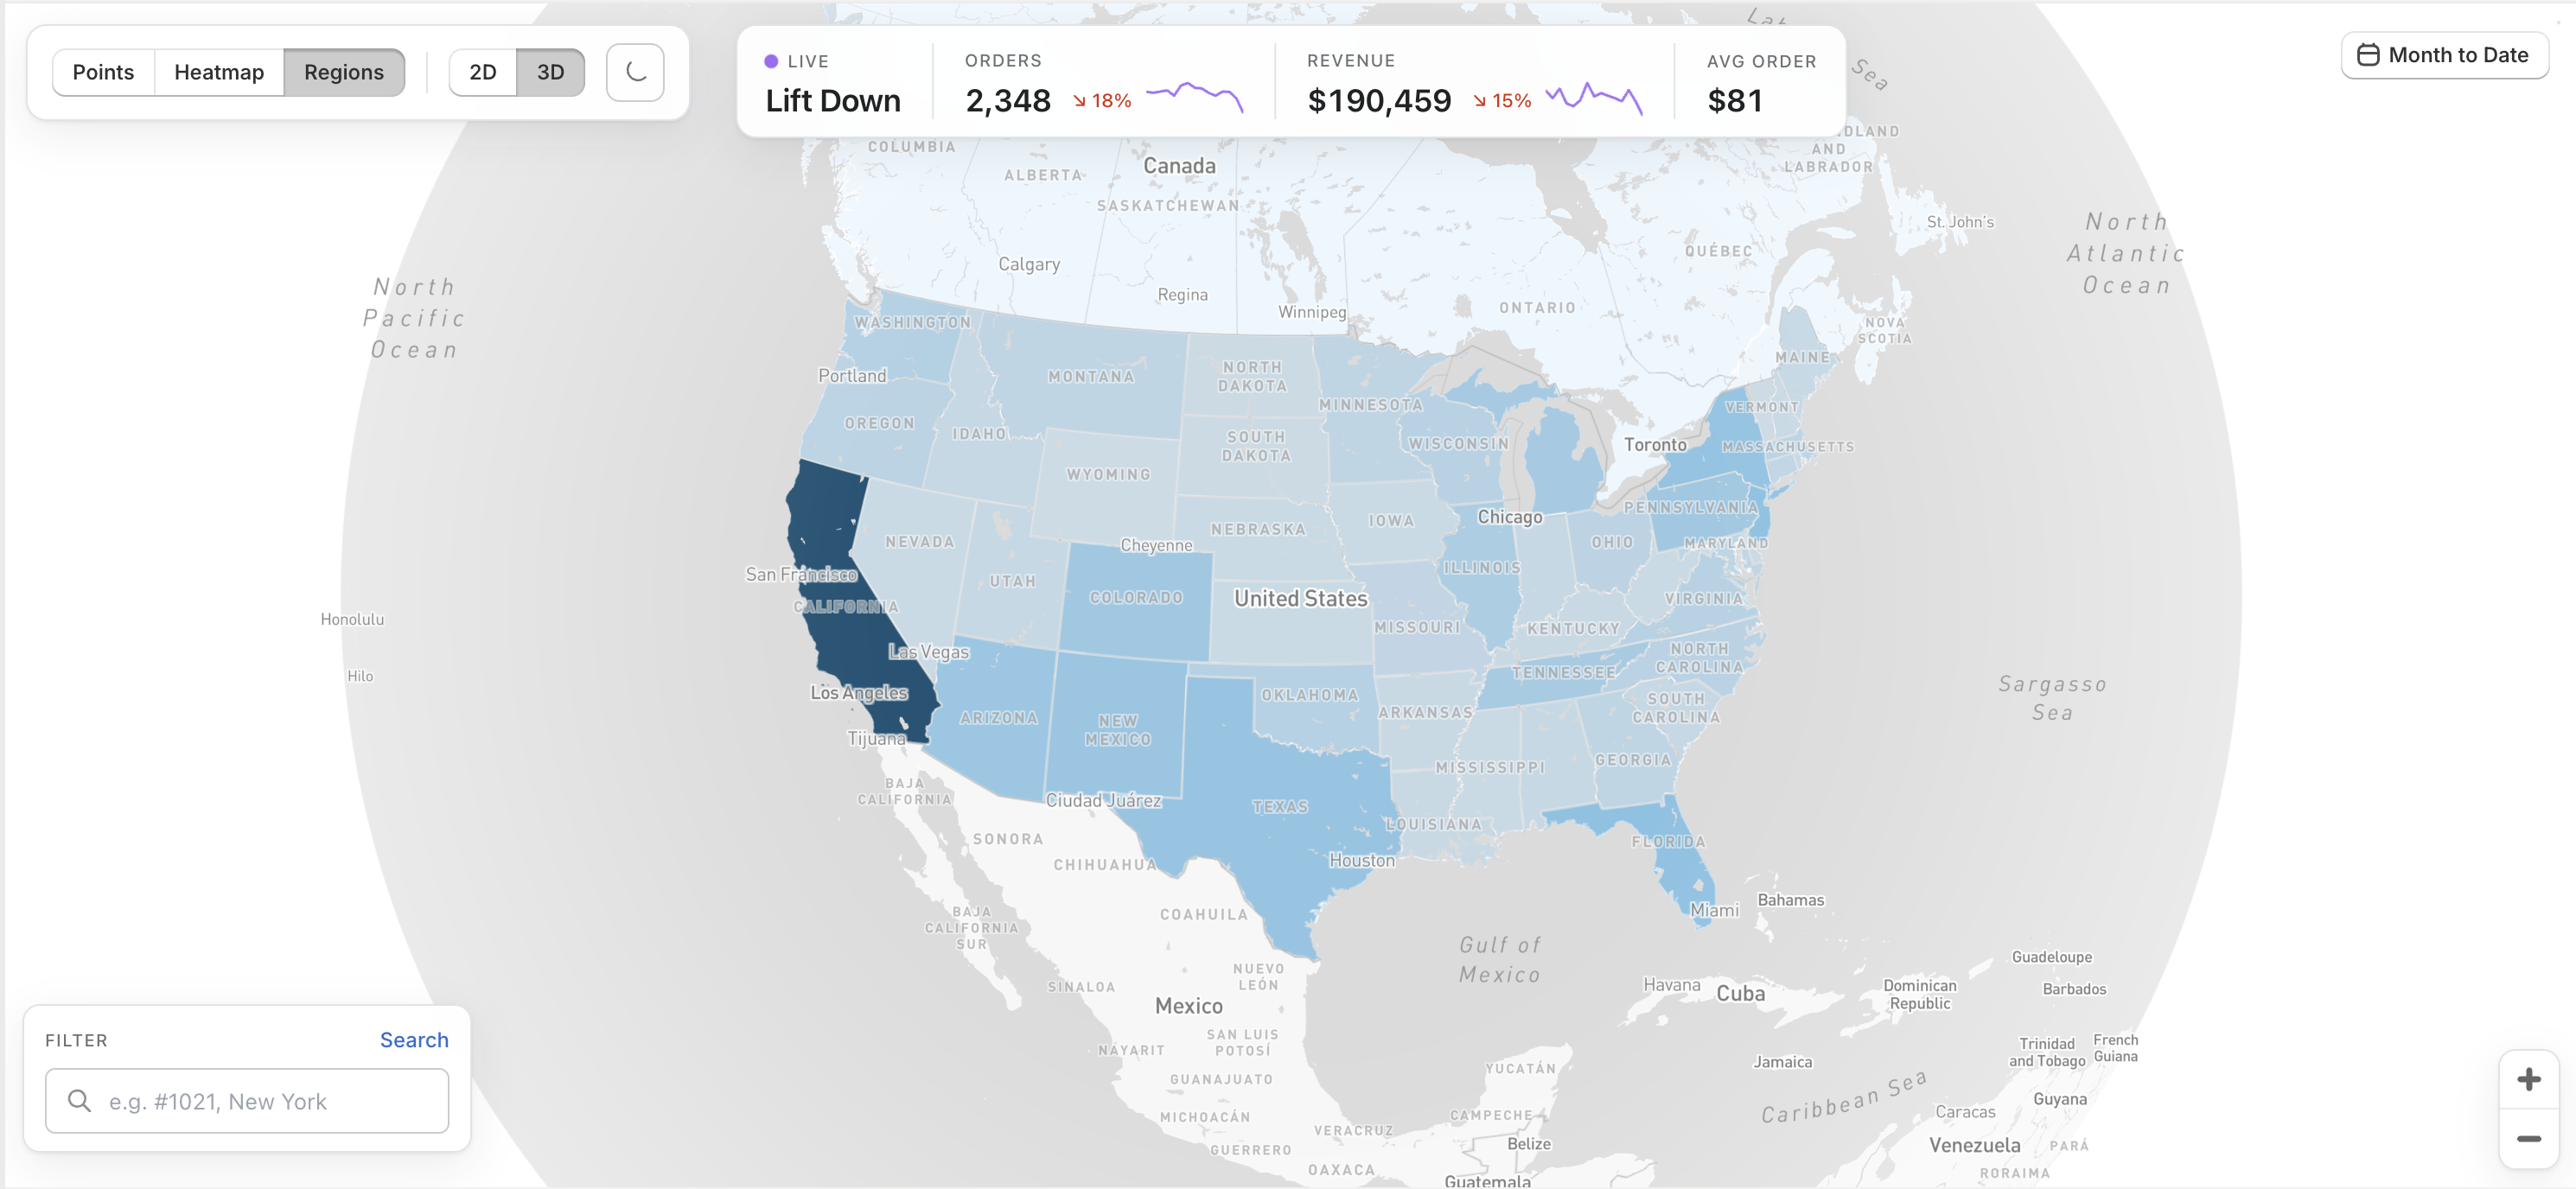
Regions
Aggregate by state, province, or country. Compare revenue, orders, and average basket across your markets.
Zoom from country to neighborhood in a single click.
Click any region to see the story beneath it — orders, revenue, average order value, and the customers driving growth.
- Per-state and per-country revenue tooltips
- Pick custom date ranges or use smart presets (7, 30, 90 days)
- Switch to 3D to see the globe breathe in real time
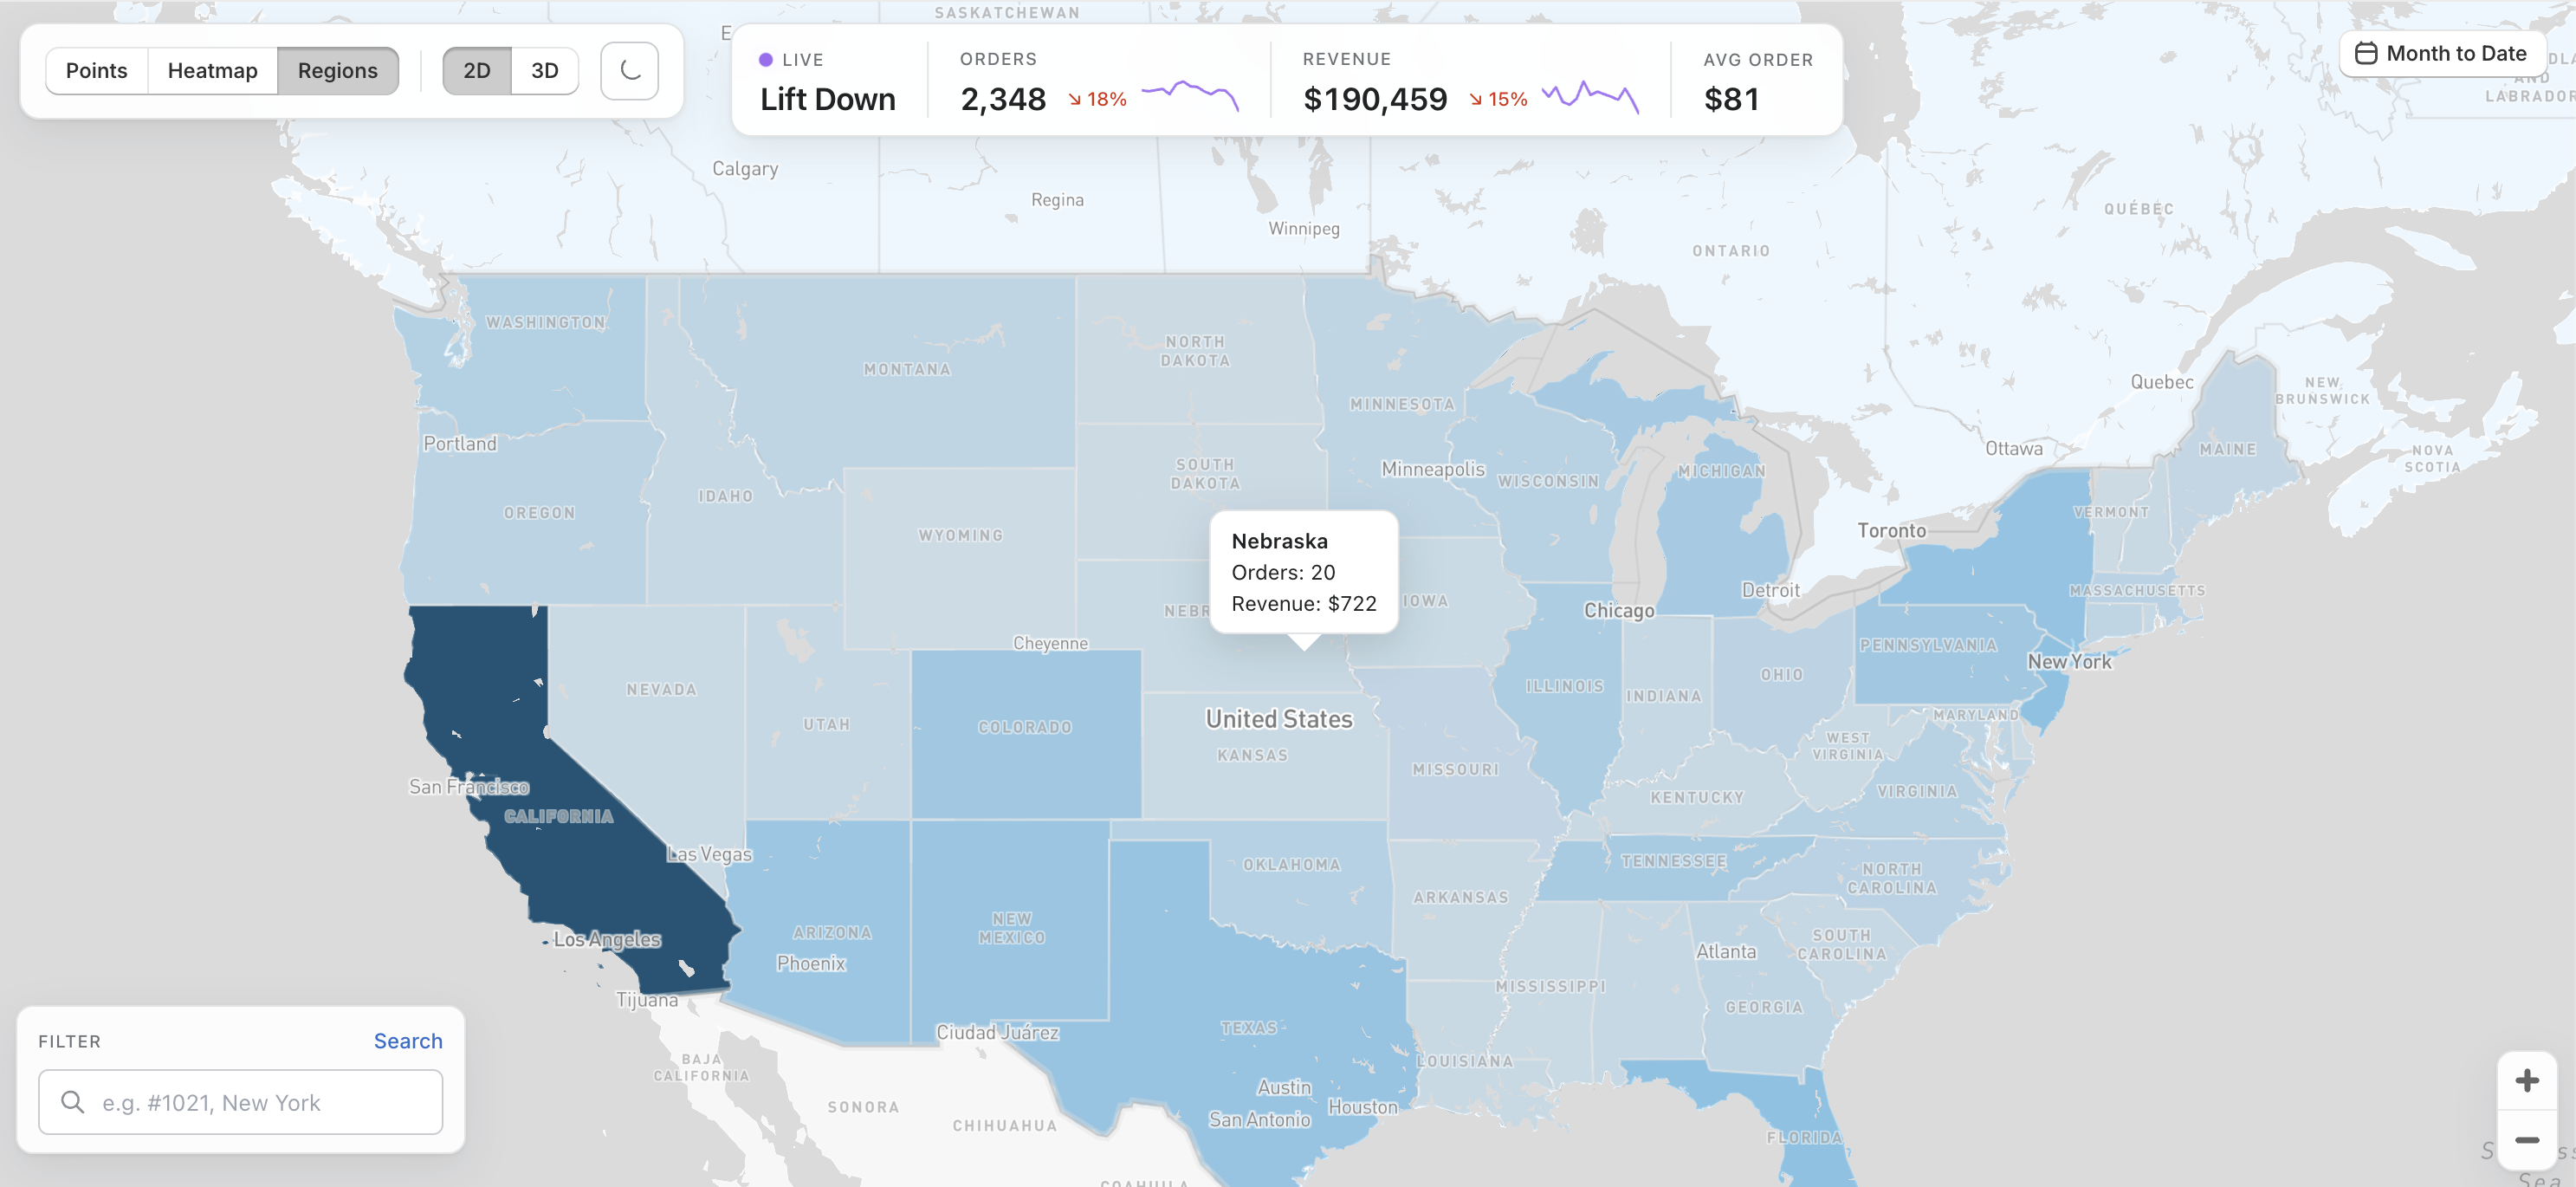
Compare markets without exporting a single spreadsheet.
Live stats follow your cursor — orders, revenue, average order, and change-over-time — right inside your Shopify admin.
- Month-to-date vs. previous period deltas
- Smart color scales that respect your data distribution
- Lasso any region and export its customers as a CSV (Pro)
Beautiful on desktop. Brilliant on the admin iPad.
From install to insight in under a minute.
Install on Shopify
One-click install from the Shopify App Store. No CSV uploads, no API keys to juggle.
Your orders sync
We pull your order history — past and live — through Shopify's official APIs, within the scopes you approve.
Explore your map
Open Naksalite from your admin and watch your store's geography come alive across points, heatmap, and regions.
Responsive from the ground up.
Look at your map between meetings, on the warehouse floor, or from a flight — the same clarity, on any screen.